
CO2-induced climate change assessment for the extreme 2022 Pakistan rainfall using seasonal forecasts
Anomalous conditions in summer 2022
Pakistan’s location in the transition zone between the moist South Asian monsoon climate and the arid hot climate of Southwest Asia makes it susceptible to influences from both21. The Asian Summer Monsoon with its seasonally reversing winds and corresponding changes in precipitation is one of the most important weather and climate phenomena for the Indian subcontinent and surrounding regions. It affects Pakistan primarily via two distinct routes: south-easterly winds from the Bay of Bengal bringing air along the foothills of the Himalayas to reach Pakistan’s northern provinces, and south-westerly airmasses from the Arabian Sea, advecting moisture into the southern provinces22.
One of the defining characteristics of the climate of the Indian subcontinent is its large interannual rainfall variability, often attributed to large-scale sea surface temperature (SST) anomalies associated with El Niño Southern Oscillation (ENSO) and the Indian Ocean Dipole (IOD) but also to factors including the springtime snow depth in the Himalayas, the presence of aerosols23,24 and internal dynamics of subseasonal variations of active – break periods25.
GPCP16 and ERA526 reanalysis data for JJA 2022 (Fig. 1b, c) clearly show the enhanced precipitation over Pakistan with maxima of anomalous rainfall over the central and southern provinces. GPCP data are available on a 2.5 degree horizontal grid while ERA5 and all model data are interpolated on a 1 degree grid. By contrast, the monsoon circulation over India and the Bay of Bengal weakened with dry anomalies over north-east India and Bangladesh. Large-scale south-easterly wind anomalies at 850 hPa extend from that region into Pakistan and reduce the flow of moist air across much of Northern India. This anomalous circulation pattern was previously identified as a principal mode of variability associated with enhanced rainfall over Pakistan27,28. A further relevant characteristic of the local atmospheric circulation in the summer 2022 is the anomalously moist air over the Arabian Sea off the coast of Pakistan which is transported inland with the mean monsoon flow. The tropical SSTs in JJA 2022 are dominated by cold anomalies of the La Niña phase of ENSO in the equatorial central and east Pacific and a negative IOD with colder temperature anomalies in the western Arabian Sea relative to the eastern Indian Ocean (Fig. 2a).
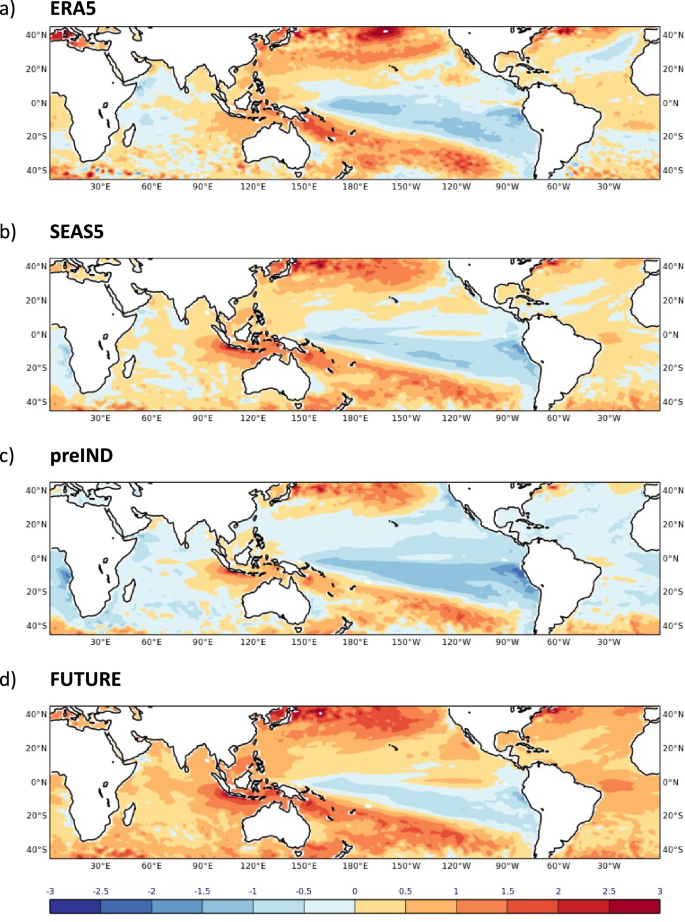
Maps show the anomalies for ERA5 (a), SEAS5 (b), preIND (c) and FUTURE (d). Anomalies in c, d are computed with respect to the SEAS5 hindcast climatology. SST units: K.
Amid the anomalous meteorological conditions in southern Asia during the summer 2022, it is important to note that whilst Pakistan to the south-west of the Tibetan Plateau had an extremely wet and cold season, the Yangtze River Valley east of the Tibetan Plateau experienced unprecedented heat29,30,31. The anomalous upper tropospheric zonal flow over Tibet is dynamically linked to opposite vertical atmospheric motion at either sides of the plateau which explains a major fraction of these two contrasting extreme events29,31. We will come back to analyse the significant role of this large-scale flow anomaly in shaping the precipitation response over Pakistan, including under climate change, in the sub-section on the role of the upper tropospheric zonal winds.
Seasonal forecasts of JJA 2022 over Pakistan
The spatial distribution of the ensemble-mean precipitation anomalies in the SEAS5 forecasts (Fig. 1e) shows widespread areas of Pakistan predicted to receive anomalous rainfall. The Pakistan-average ensemble-mean absolute precipitation rate of 2.71 mm/day is higher than in any other JJA season of the retrospective hindcast period 1993–2016 for which the SEAS5 system was tested, being nearly 3 standard deviations above the hindcast period mean. This amounts to an ensemble-mean anomaly of 0.88 mm/day or approximately 150% of the SEAS5 climatological rainfall during the hindcast reference period. The probability of exceeding the upper quintile of the climatological rainfall distribution during JJA 2022 is 73% for the country-wide average, which is notably much larger than its climatological value of 20%.
For comparison, the ERA5 absolute rainfall average over Pakistan during JJA 2022 amounts to 4.20 mm/day, corresponding to approximately 3 standard deviations above the hindcast mean, an anomaly of 2.1 mm/day and 200% of its climatological mean, and substantially exceeding any other year’s amount over the similar historical period. GPCP’s absolute rainfall over Pakistan amounts to 4.09 mm/day, which corresponds to 3.5 standard deviations, an anomaly of 2.3 mm/day and approximately 230% of its climatological mean. In the following, we restrict our comparison mainly to ERA5, acknowledging that GPCP data are broadly similar in spatial structure and anomalous amount.
The reason for the smaller SEAS5 ensemble-mean rainfall amount when compared to the observation-based reanalysis is simple—the ensemble mean forecast is a smoothed estimate based on 51 individual forecast member realisations from which the unpredictable “noise” amongst the members has been filtered. It is important to note though that the wettest ensemble member (Pakistan-wide: 4.31 mm/day), shown in Fig. 1d, is indeed able to produce a similar magnitude of total rainfall to those in ERA5, highlighting the realism of the SEAS5 coupled ocean-atmosphere model. Since coarser-scale climate models notoriously underestimate rainfall extremes, these results demonstrate a remarkable success in modelling extreme seasonal-mean precipitation amounts and increase the trustworthiness of these seasonal forecasts.
The extreme rainfall anomalies in the mean forecast are associated with increased lower tropospheric specific humidity and a weakened 850 hPa monsoon circulation across the Indian subcontinent, see Fig. 1f, and reflect the observed situation accurately. In particular, the south-easterly flow anomaly from the Bay of Bengal across northern parts of India is well captured. The wettest ensemble member is associated with a strong positive humidity anomaly over the Arabian Sea and Pakistan and strong south-easterly wind anomalies over the sea off the coast of Pakistan (Fig. 1g). The ensemble member with the strongest rainfall over Pakistan also predicts the largest specific humidity anomaly across the SEAS5 ensemble in the region and shows the second strongest easterly anomaly in the winds within the ensemble across the Pakistan coast. The level of extremeness of the humidity anomaly reaches nearly 3 standard deviations of the model climatology, whereas the wind anomaly is less extreme with approximately 1.5 standard deviations. Overall, these results confirm the important roles of both the humidity and the atmospheric circulation for simulating realistic rainfall totals.
The tropical SST conditions with cold La Niña temperatures over the Pacific and a negative dipole over the Indian Ocean are well reproduced in the SEAS5 forecasts (Fig. 2b).
Climate change experiments for the summer 2022
To estimate the extent of loss and damage associated with the extreme rainfall and caused by human-induced climate change, we must first be able to quantify reliably by how much the JJA 2022 rainfall anomalies over Pakistan were exacerbated by climate change. However, as noted above, conventional climate models are unable to simulate important rainfall characteristics like the magnitude of precipitation extremes, thus rendering any derived quantification of the role of climate change unreliable. On the other hand, we have shown that the ECMWF high-resolution SEAS5 model had forecast this event with good fidelity. We thus use the successful simulations of SEAS5 as a starting point for our investigations into the role of anthropogenic CO2-driven climate change on the extreme rainfall. By only modifying the radiative forcing of the control forecasts together with perturbing the ocean initial conditions correspondingly, we will show how the SEAS5 anomalies respond to these perturbations, while all other conditions are kept unchanged. Such a reductionist approach provides insight into the specific roles of the imposed changes, while avoiding the inclusion of additional confounding factors.
In particular, we create two additional seasonal forecasts for JJA 2022 in hypothetical, or counterfactual, worlds: the first (“preIND”) uses atmospheric CO2 concentrations that are fixed at pre-industrial levels of 285 ppm, and in the second (“FUTURE”) the CO2 concentrations were increased to 615 ppm19,20. Present-day concentrations of 415 ppm are used in operational SEAS5 forecasts. In the forecast experiments for these counterfactual worlds, we not only change the CO2 concentrations, but also adjust the forecast initial conditions to account for past and future warming. Since seasonal predictability is primarily accounted for by information in ocean initial conditions32, for the counterfactual forecasts we have adapted the ocean initial conditions such as to reflect the impact of CO2 concentrations on the initial state of the ocean. Details of the technique to perturb the ocean, together with a description of all model experiments, are given in the Methods Section.
The JJA 2022 seasonal-mean ensemble-mean rainfall anomalies and climate change signals from both counterfactual forecasts preIND and FUTURE are displayed in Fig. 3a, b. Here, the past signal is estimated as SEAS5 minus preIND and the future signal as FUTURE minus SEAS5, so that both signals reflect the impact of the increased forcing. The rainfall anomalies over Pakistan in both experiments are large, though smaller (0.60 mm/day in preIND and 0.75 mm/day in FUTURE) than in SEAS5 (0.88 mm/day, see Fig. 1e), which shows that the magnitude of the rainfall event of the past and future simulations is similar to present-day conditions and implies that neither counterfactual has a strong impact on the extreme wet conditions per se. Even under preindustrial or strongly increased CO2 forcing levels in the future, the summer in Pakistan would have been extremely wet. This indicates a limited role of the CO2 forcing for the extreme event.
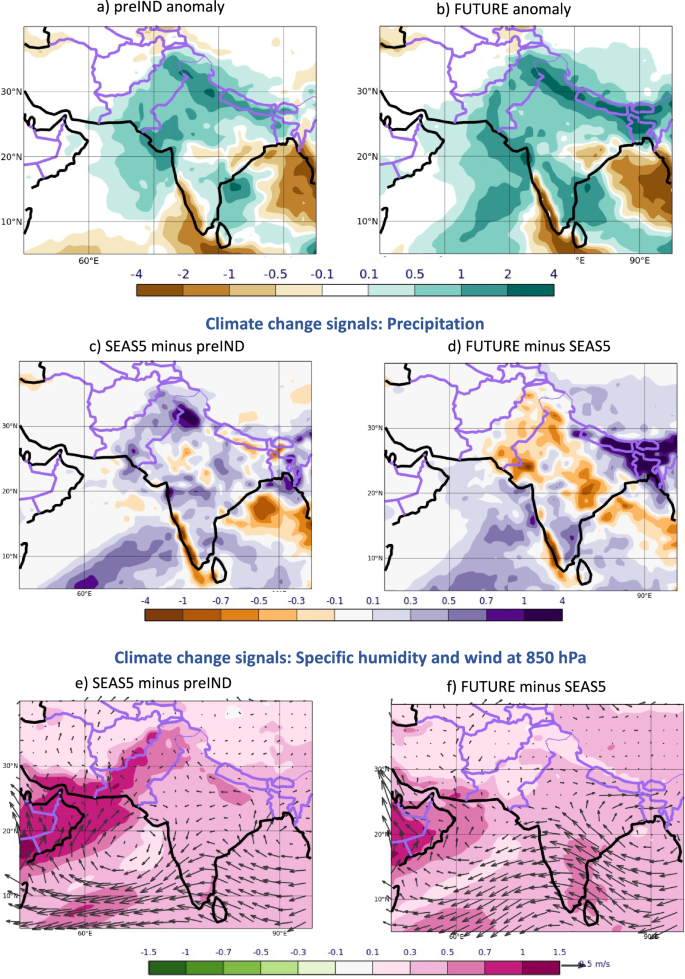
Precipitation anomalies in the preIND (a) and FUTURE (b) simulations. c–f Climate change signals of JJA 2022 in the past (c, e) and for the future (d, f) for precipitation (c, d) and specific humidity with winds at 850 hPa (e, f). Climate change signals are defined as the difference between simulations with stronger CO2 and SST forcings minus simulations with weaker CO2 and SST forcings. The past climate change signals (c, e) are estimated as SEAS5 minus preIND; the future climate change signals (d, f) are estimated from FUTURE minus SEAS5. Precipitation units: mm/day, specific humidity units: g/kg and wind units: m/s.
The historical rainfall climate change signal, that is the difference between the operational forecast of SEAS5 and the experiment preIND, shows a small increase of the ensemble-mean precipitation over Pakistan in SEAS5 compared to what it would have been if CO2 concentrations in JJA 2022 were at pre-industrial levels and the global oceans were colder (Fig. 3c). For the country-wide average, the counterfactual preIND prediction of 2.43 mm/day amounts to a 0.28 mm/day, or approximately 10%, reduction over the current-day SEAS5 forecast. This mean rainfall change from preIND to SEAS5 is statistically significant with a p-value of 0.015. The past climate change signals of specific humidity and winds at 850 hPa (Fig. 3e) indicate strengthened monsoon winds leading to an increased south-westerly transport of moister air from the Arabian Sea into Pakistan, contributing to the increased precipitation signal.
The mean climate change signal of precipitation for future conditions (Fig. 3d), that is the difference between the FUTURE forecast experiment and the SEAS5 forecasts, changes its sign: further increased CO2 concentrations and warming of the global oceans do not further increase the mean precipitation totals over Pakistan as they did in the past. The FUTURE ensemble-mean rain is reduced over the operational SEAS5 forecast by 0.13 mm/day to 2.58 mm/day. If the response to a further rise of CO2 were purely thermodynamic, a further increase in mean rainfall in FUTURE would have been expected. However, FUTURE shows a (non-significant) reduction of approximately 5% in Pakistan-wide rainfall over the SEAS5 forecasts instead.
The associated lower tropospheric humidity and circulation signals in FUTURE (Fig. 3f) are consistent with the precipitation signal. Humidity increases between SEAS5 and FUTURE, especially over the Arabian Sea, are reduced compared to the past signal between preIND and SEAS5. The very weak response from SEAS5 to FUTURE in winds off the coast of Pakistan suggests that the increased advection of moist air from the sea into Pakistan, as found in the past, is absent in the future climate change signal.
Characteristics of the rainfall distributions over Pakistan
It is, of course, important to examine not just the ensemble mean but also the full ensemble distributions of rainfall. To this end, we show histograms (Fig. 4a) and cumulative distribution plots (Fig. 4b) of JJA absolute rainfall averaged over Pakistan for the SEAS5 seasonal forecasts and the two counterfactual forecasts preIND and FUTURE. The climatological distributions of ERA5, GPCP and SEAS5 during the 1993–2016 period are displayed in Fig. 4 in different shades of grey colour. The climatological distribution of SEAS5 is based on 51 ensemble members in the hindcasts, resulting in a much finer histogram and smoother distributions than the observed datasets. There is a remarkably good agreement between the model climatology and the ERA5/GPCP distributions, with comparable levels of variability and only a very small dry bias in the hindcasts.
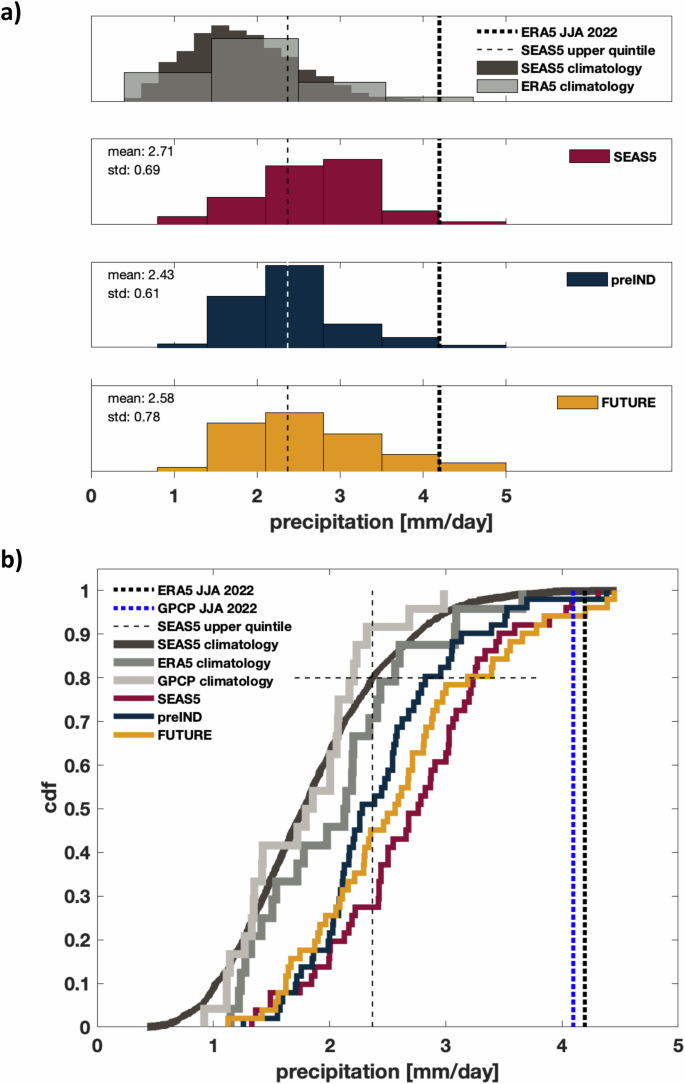
a Histograms with the light grey showing JJA precipitation in ERA5 over the 24-year climatological reference period 1993–2016. The dark grey histograms shows JJA precipitation in SEAS5 over the same period estimated form all 51 hindcast ensemble members. Forecast distributions for JJA 2022 from the 51 SEAS5 (red), preIND (dark blue) and FUTURE (yellow) ensemble members. The dotted vertical lines in all panels indicate the amount of rainfall during JJA 2022 in ERA5 and GPCP. The dashed vertical line in all panels indicates the rainfall threshold of the upper quintile of the SEAS5 climatological distribution. The inset numbers indicate the ensemble mean and standard deviation for each forecast ensemble. All histograms have been normalised such that the sum of the bar areas equals 1. b Cumulative distributions of precipitation in ERA5, GPCP and for the different simulations.
With the 51-member operational SEAS5 forecast plotted in red, both the histograms and cumulative distributions highlight the shift to extremely wet conditions in JJA 2022 compared to the SEAS5 hindcast climatology. This shift towards higher rainfall impacts not only the mean but the entire forecast distribution including the dry and wet extremes. From Fig. 4b we see that the climatological SEAS5 upper quintile threshold of 2.37 mm/day (i.e., 80th climatological percentile of the seasonal mean rainfall distribution, see dashed vertical line) is exceeded by approximately 70% of the SEAS5 forecast ensemble members. The wettest forecast member produces slightly more rain than ERA5 and GPCP.
The distributions of both counterfactual ensembles, shown in Fig. 4 in dark blue for the preIND reduced CO2 concentration experiment and in yellow for the FUTURE increased CO2 concentration experiment, are also clearly shifted towards wetter-than-normal conditions, similarly to SEAS5. By taking the quantile of the cumulative forecast distributions in Fig. 4b at the climatological upper quintile precipitation threshold, we estimate that the probability of exceeding the climatological SEAS5 upper quintile in preIND is nearly 50% which implies that the risk of high precipitation amounts is still greatly increased over its reference climatological value of 20%, yet not as much as in the SEAS5 forecast using current-day CO2 concentrations. Equally, the FUTURE probability of exceeding the upper quintile, 55%, remains strongly enhanced over its climatological reference, though less so than in SEAS5.
This significant and consistent shift away from the climatology towards very wet conditions implies that other factors not directly influenced by the CO2 concentrations and global ocean temperatures were mainly responsible for the anomalous rainfall in the summer 2022 forecasts. Tropical SST anomalies in both the preIND and FUTURE experiments show clear signals of La Niña and a negative IOD (Fig. 2c, d). However, precipitation over south-west Asia is highly variable on interannual timescales21. While intermittent co-occurrences of ENSO events during extreme summer rainfall seasons over Pakistan were observed in the past, the overall statistical relationship of ENSO-forced teleconnections is weak and not robust. Dynamical processes of internal atmospheric variability like jet stream meandering and circumglobal wave patterns are known to modulate the precipitation distribution over the region. The simultaneous acting of several oceanic and atmospheric drivers can lead to amplified precipitation responses19. An in-depth analysis of the physical nature of these potential drivers is not the focus of this study and has been discussed elsewhere18,29,30,31.
In summary, we find that the overall shift towards very wet absolute conditions for the 2022 summer season is still observed in both counterfactual experiments, highlighting the primary role of other drivers than anthropogenically induced CO2 for interannual rainfall variability and thus the extreme event of 2022. In addition, both perturbed forecast ensembles produce less mean rainfall than the operational SEAS5 forecast. The cumulative distribution plots in Fig. 4b clearly indicate the reduction in rainfall for the counterfactual experiments across the distributions. While the upper tail of the preIND distribution remains drier than SEAS5, the FUTURE ensemble includes several extreme members with more rainfall than the wettest members in SEAS5 and 3 ensemble members exceeding the ERA5 rainfall totals for 2022. This increase in variability for the FUTURE simulation is, however, too small to prove statistically significant in an F-test.
The role of the upper-troposphere zonal wind
How can our rainfall results – where past climate change from pre-industrial conditions to today increased the precipitation over Pakistan by up to 10%, yet similar forcings in the future tend to slightly decrease it – be understood?
An important aspect to the extreme wet season in Pakistan is the anomalous zonal flow over the Tibetan Plateau. In summer, the climatological high potential temperatures over the western Tibetan Plateau together with the climatological upper-tropospheric subtropical westerly flow generate descending vertical motion to the west and ascent further east. Climatological descent to the west is associated with warming and drying and has a direct effect on maximum temperatures and precipitation at the surface29. On the downstream eastern side of the plateau, the ascending vertical motion leads to a wetter climate over sub-tropical East Asia.
In JJA 2022, however, the westerly wind circulation in the upper troposphere over Tibet and surrounding areas was substantially weaker than in its long-term climatological mean29. The resulting negative zonal wind anomalies at 200 hPa in ERA5 are shown in Fig. 5a. With the blue line indicating the region of easterly upper tropospheric winds in the tropics, these anomalies can be interpreted as an expansion of the tropical easterly regime and a northward shift of the westerly jet. The SEAS5 forecasts correctly predicted large-scale easterly anomalies over subtropical Asia and the Tibetan Plateau (Fig. 5b), yet differences of zonal flow anomalies exist across the ensemble, manifesting in a weaker ensemble mean circulation anomaly locally over Pakistan and an eastward shift of the maxima of the circulation anomalies.
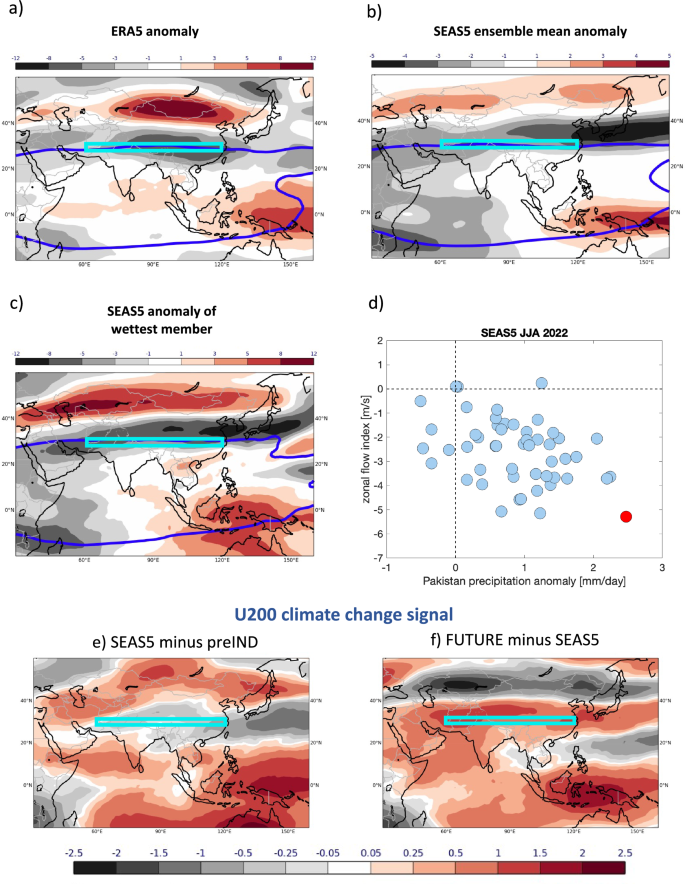
Anomaly of the zonal wind at 200 hPa (U200) during JJA 2022 in (a) ERA5, (b) SEAS5 ensemble mean and (c) the ensemble member with the strongest precipitation anomaly over Pakistan. The blue thick lines indicate the reversal of tropical easterlies to extratropical westerly flow. The cyan coloured boxes in (a–c) show the area over the Tibetan Plateau that is used to define the zonal flow index. d Scatter diagram of the relationship between the zonal flow index and precipitation anomaly over Pakistan in the SEAS5 forecast ensemble. The ensemble member with the highest precipitation anomaly is highlighted. U200 climate change signals of JJA 2022 in the past (e) and for the future (f). Climate change signals are defined as the difference between simulations with stronger CO2 and SST forcings minus simulations with weaker CO2 and SST forcings. The past climate change signal (e) is estimated as SEAS5 minus preIND; the future climate change signal (f) is estimated from FUTURE minus SEAS5. Wind units: m/s.
Based on reanalysis and observational data, it has been demonstrated elsewhere29 that the easterly flow anomalies in the upper troposphere over the Tibetan Plateau during the summer 2022 dynamically induced strong ascent to the west of the plateau, leading to the observed positive rainfall anomalies in Pakistan. To test whether a similar dynamic mechanism is active in our forecasts, we quantify the relationship between the large-scale upper tropospheric circulation and rainfall over Pakistan by defining a zonal flow index as the mean zonal wind anomaly at 200 hPa over a region above the Tibetan Plateau where the strongest easterly wind anomalies occurred (cyan box in Fig. 5a, see Methods). The zonal flow index of the ERA5 anomaly is -5.1 m/s, for the ensemble mean of SEAS5 it is -2.6 m/s with the largest negative anomaly within the ensemble being -5.3 m/s.
The scatterplot of the SEAS5 zonal flow index anomalies for each ensemble member against its rainfall anomaly in Pakistan in Fig. 5d clearly shows that our model captures the described observed relationship between the large-scale circulation anomaly and rainfall over Pakistan, with the correlation of r = -0.39 being highly significant (p = 0.004). Indeed, the ensemble member with the highest rainfall (see also Fig. 1d) also shows the strongest upper air easterly wind anomaly (Fig. 5c).
Given the realism of the physical mechanism connecting atmospheric circulation anomalies with precipitation signals in Pakistan in the SEAS5 model, the question arises whether the sign change of the precipitation climate signal from pre-industrial to future conditions (Fig. 3c, d), can also be detected in the large-scale upper-air zonal flow climate signals. In Fig. 5e, f we see indeed that in the past the total climate change signal showed a mean weakening of the westerly zonal flow component by approximately 0.3 m/s (Fig. 5e), consistent with a weak increase in precipitation. In contrast, the future climate change signal shows a mean strengthening of the westerly flow component by approximately 0.9 m/s (Fig. 5f), consistent with the weak decrease in precipitation found in the simulations. The statistical relationship between the ensemble rainfall anomalies over Pakistan and the upper tropospheric zonal flow index is slightly reduced in the preIND counterfactual simulation (r = -0.34 with p = 0.015) and slightly strengthened in the FUTURE simulation (r = -0.46 with p = 0.001). As with the precipitation sensitivities, the circulation signals induced by changes in the CO2 and SST forcings are small compared to the magnitude of the upper tropospheric wind anomaly (approximately 10% and 30%).
The direct CO2 and SST contributions to the climate change signal
While these findings for the upper tropospheric circulation changes are in full agreement with the results for precipitation, they alone cannot tell us what causes the opposing signals in the past and future. We have thus performed two additional numerical experiments, A and B, to help us disentangle the contributions behind the change in the climate signals. The motivation for these experiments is the following: Our hypothetical climate change experiments both apply two simultaneous perturbations to the physical climate system: to the CO2 forcing in the atmosphere and to the initial 3D-state of the ocean temperatures as felt by the atmosphere through the SSTs. From these it remains unclear how each of these two perturbations individually impact the precipitation signal over Pakistan. Difference in their individual contributions in the past and future can potentially lead to the nonlinear behaviour that we find for the precipitation climate change signal.
The schematic in Fig. 6 illustrates our approach, how the additional experiments A and B complement the preIND and FUTURE experiments, and what they can tell us about the relative roles of the CO2 and SST perturbations. Experiment A uses pre-industrial CO2 concentrations while the SSTs and 3D ocean and sea-ice temperatures (at initial time) are the same as in SEAS5. Contrasting A with SEAS5 reveals the past effect that perturbations of the CO2 forcing had without accounting for changes in the ocean (hereafter called past direct CO2 contribution). Contrasting A with preIND reveals the past effect from initial SST and sea-ice perturbations only, without accounting for changes in CO2 (hereafter called direct past SST contribution). By analogy, experiment B is forced with increased future CO2 concentrations while the initial SSTs are kept the same as in SEAS5. Here, the difference between B and SEAS5 reveals the future direct CO2 contribution and neglects changes in the ocean. The difference of FUTURE and B uncovers the corresponding future direct SST contribution while ignoring CO2 changes. The sum of the direct CO2 and direct SST contributions equals the total climate change signal that we discussed in Fig. 3c, d for precipitation and in Fig. 5e, f for the upper tropospheric zonal winds.
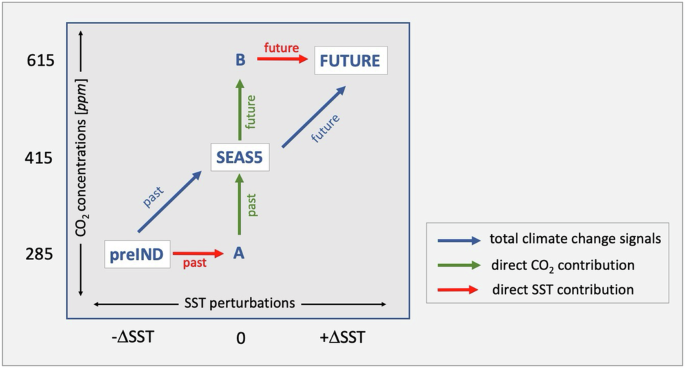
The operational forecast based on SEAS5 uses CO2 concentrations of 415 ppm and serves as the reference. Contrasting SEAS5 with preIND defines the past total climate change signal; contrasting FUTURE with SEAS5 determines the future total climate change signal. The two additional experiments A and B use lower and higher CO2 concentrations than SEAS5 without simultaneously perturbing the SSTs and thus allow to estimate the direct CO2 and SST contributions to the total climate change signals, as indicated by the green and red arrows.
Results from the direct contribution experiments are shown in Fig. 7 for precipitation and of Fig. 8 for the upper-tropospheric zonal winds. The direct SST contribution leads to a weak wet signal (0.08 mm/day) over Pakistan for past changes (Fig. 7a). The future direct SST contribution (Fig. 7b), however, reveals a drying signal of -0.25 mm/day if the ocean temperatures are further increased. In contrast, the direct CO2 contribution signal is estimated to be to consistent increased rainfall in the past (0.20 mm/day) and in the future (0.12 mm/day), see Fig. 7c, d. We can thus conclude that the CO2 perturbations primarily contribute to the total signal of increasing precipitation (Fig. 3c) due to climate change in the past. The situation in the future is different though: the drying due to warmer future SSTs overcompensates the continued wet signal from the direct CO2 contribution, resulting in a total dry signal for future climate change (Fig. 3d).
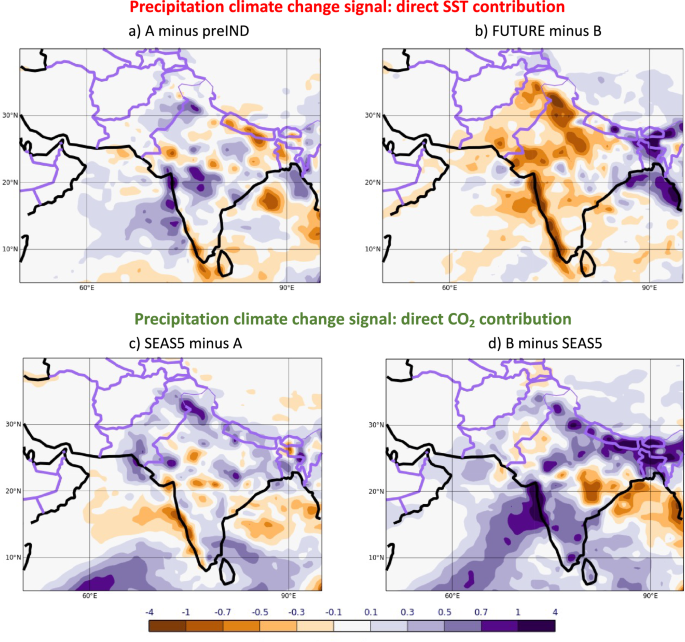
The total climate change signals (shown in in Fig. 3a, b) are the sum of contributions from direct SST and CO2 perturbations. All signals are defined as the difference between simulations with stronger SST/CO2 forcings minus simulations with weaker SST/CO2 forcings. Further illustration of all experiments is given in the schematic of Fig. 6. Precipitation units: mm/day. Past changes are shown on the left (a, c) and future changes on the right (b, d). SST changes are shown at the top (a, b) and CO2 changes are shown at the bottom (c, d).
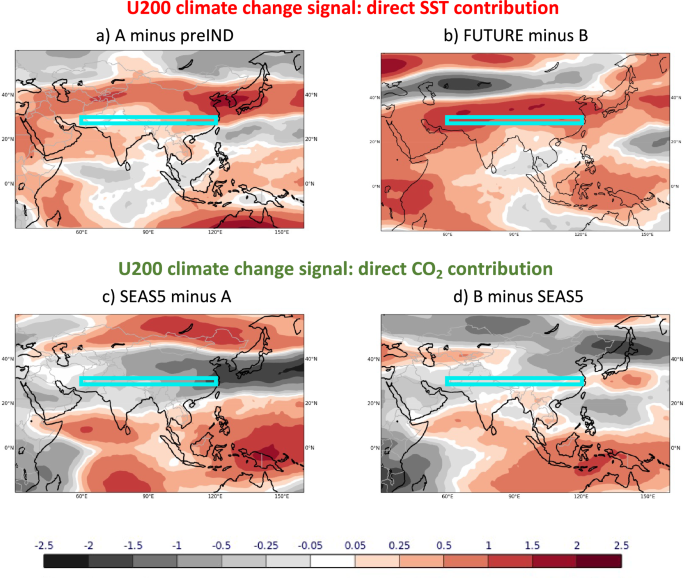
Past changes are shown on the left (a, c) and future changes on the right (b, d). The total climate change signals (shown in Fig. 5e, f) are the sum of contributions from direct SST (a, b) and CO2 (c, d) perturbations. All signals are defined as the difference between simulations with stronger SST/CO2 forcings minus simulations with weaker SST/CO2 forcings. Further illustration of all experiments is given in the schematic of Fig. 6. Wind units: m/s.
The dynamically linked upper air zonal flow over the Tibetan Plateau shows in Fig. 8 that the direct SST contributions consistently act to increase the westerly flow component in the past and future in the region of the zonal flow index (Fig. 8a, b) with increased forcing. The direct CO2 contributions, on the other hand, consistently act in the opposite direction and weaken the westerly (or increase the easterly) flow component (Fig. 8c, d). This consistency in the sign of the individual climate change circulation response to the CO2 and SST effects lends support to the robustness of the physical and dynamical processes involved in both.
However, despite this agreement in the individual responses, the total zonal wind signal in the future with its westerly flow component (Fig. 5f) is opposite to the easterly flow component of the past signal (Fig. 5e). Through the dynamical links described, these circulation changes can be understood as the result of a wet climate change signal for Pakistan in the past but a drying signal in the future. Our decomposition analysis reveals that the varying magnitudes, or strength, of the individual CO2 and SST direct effects, lead to the described non-linearities in the rainfall response to climate change. In the past, the direct CO2 contribution effect dominated the upper air circulation, and the combined effect of the SSTs and CO2 resulted in a strengthening of the easterly flow component over the Tibetan Plateau, and thus led to increased precipitation over Pakistan. The radiative effects of the CO2 changes alone (that is without their effect on the ocean temperatures) act to shift the westerly jet northwards and strengthen the upper tropospheric easterlies over the Tibetan Plateau, counteracting the direct SST effect to weaken the easterly anomalies. In the future, however, the SST effect of warmer ocean temperatures becomes stronger, relatively more important and outweighs the direct CO2 effect. The net result is a weakening of the easterly flow component (strengthening of the westerly component) and thus a reduction in rainfall over Pakistan.
Since all forecasts are performed with a coupled atmosphere-ocean system, the ocean temperatures interact with the atmosphere over time. In the perturbed CO2 concentration-only experiments where the initial conditions of the ocean are unperturbed (Fig. 6a, b), the SSTs will start to adapt to the CO2 forcings and thus produce, in addition to the direct CO2 contributions, an indirect SST imprint on the climate change signals. As we saw in the analysis above, the effect of the SSTs works in the opposite direction to the effect of the CO2 concentrations. This negative feedback between the direct SST and CO2 effects means that the direct CO2 contributions shown in Figs. 7a, b and 8a, b are conservative estimates of the “true” individual contributions because of the slow indirect SST increases during the 4-month-long simulations. The “true” direct CO2 contributions if the SSTs would not contribute are thus likely larger than those shown in the figure. We estimate the indirect SST warming to be roughly 50% of the total SST change in our preIND and FUTURE experiments relative to SEAS5 (Fig. 9).
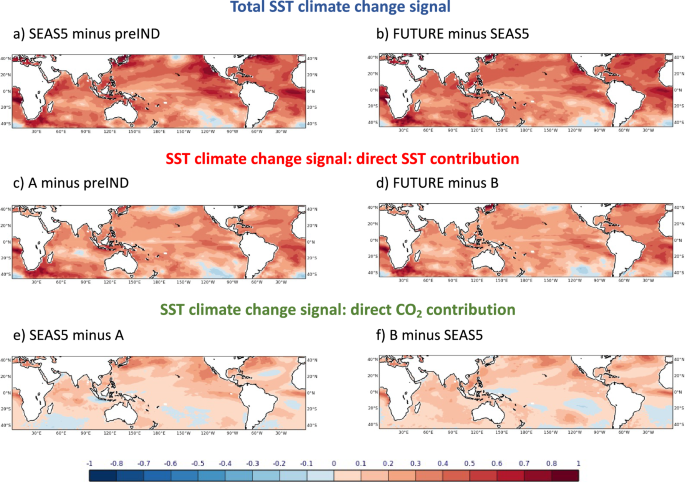
The total climate change signals (a, b) are the sum of contributions from direct SST (c, d) and CO2 (e, f) perturbations. All signals are defined as the difference between simulations with stronger CO2 and SST forcings minus simulations with weaker CO2 and SST forcings. Illustration of all experiments is given in the schematic of Fig. 6. Temperature units: K.

